BigClust
Try it without building anything
uvx bigclust2@latest --from https://flyem.mrc-lmb.cam.ac.uk/flyconnectome/bigclust_data/examples/MaleCNS_FlyWire_hemibrain_central_brain_bigclust
That opens a public example project: 87,263 central brain neurons from FlyWire, MaleCNS and Hemibrain, co-clustered by connectivity and streamed straight over HTTP. No account, no credentials, nothing to download first.
Select a cluster (Shift+Drag) and the 3D viewer shows you those neurons from all three connectomes at once, in a common space.
What you are looking at
Every region of the window has a page behind it. Click a number.
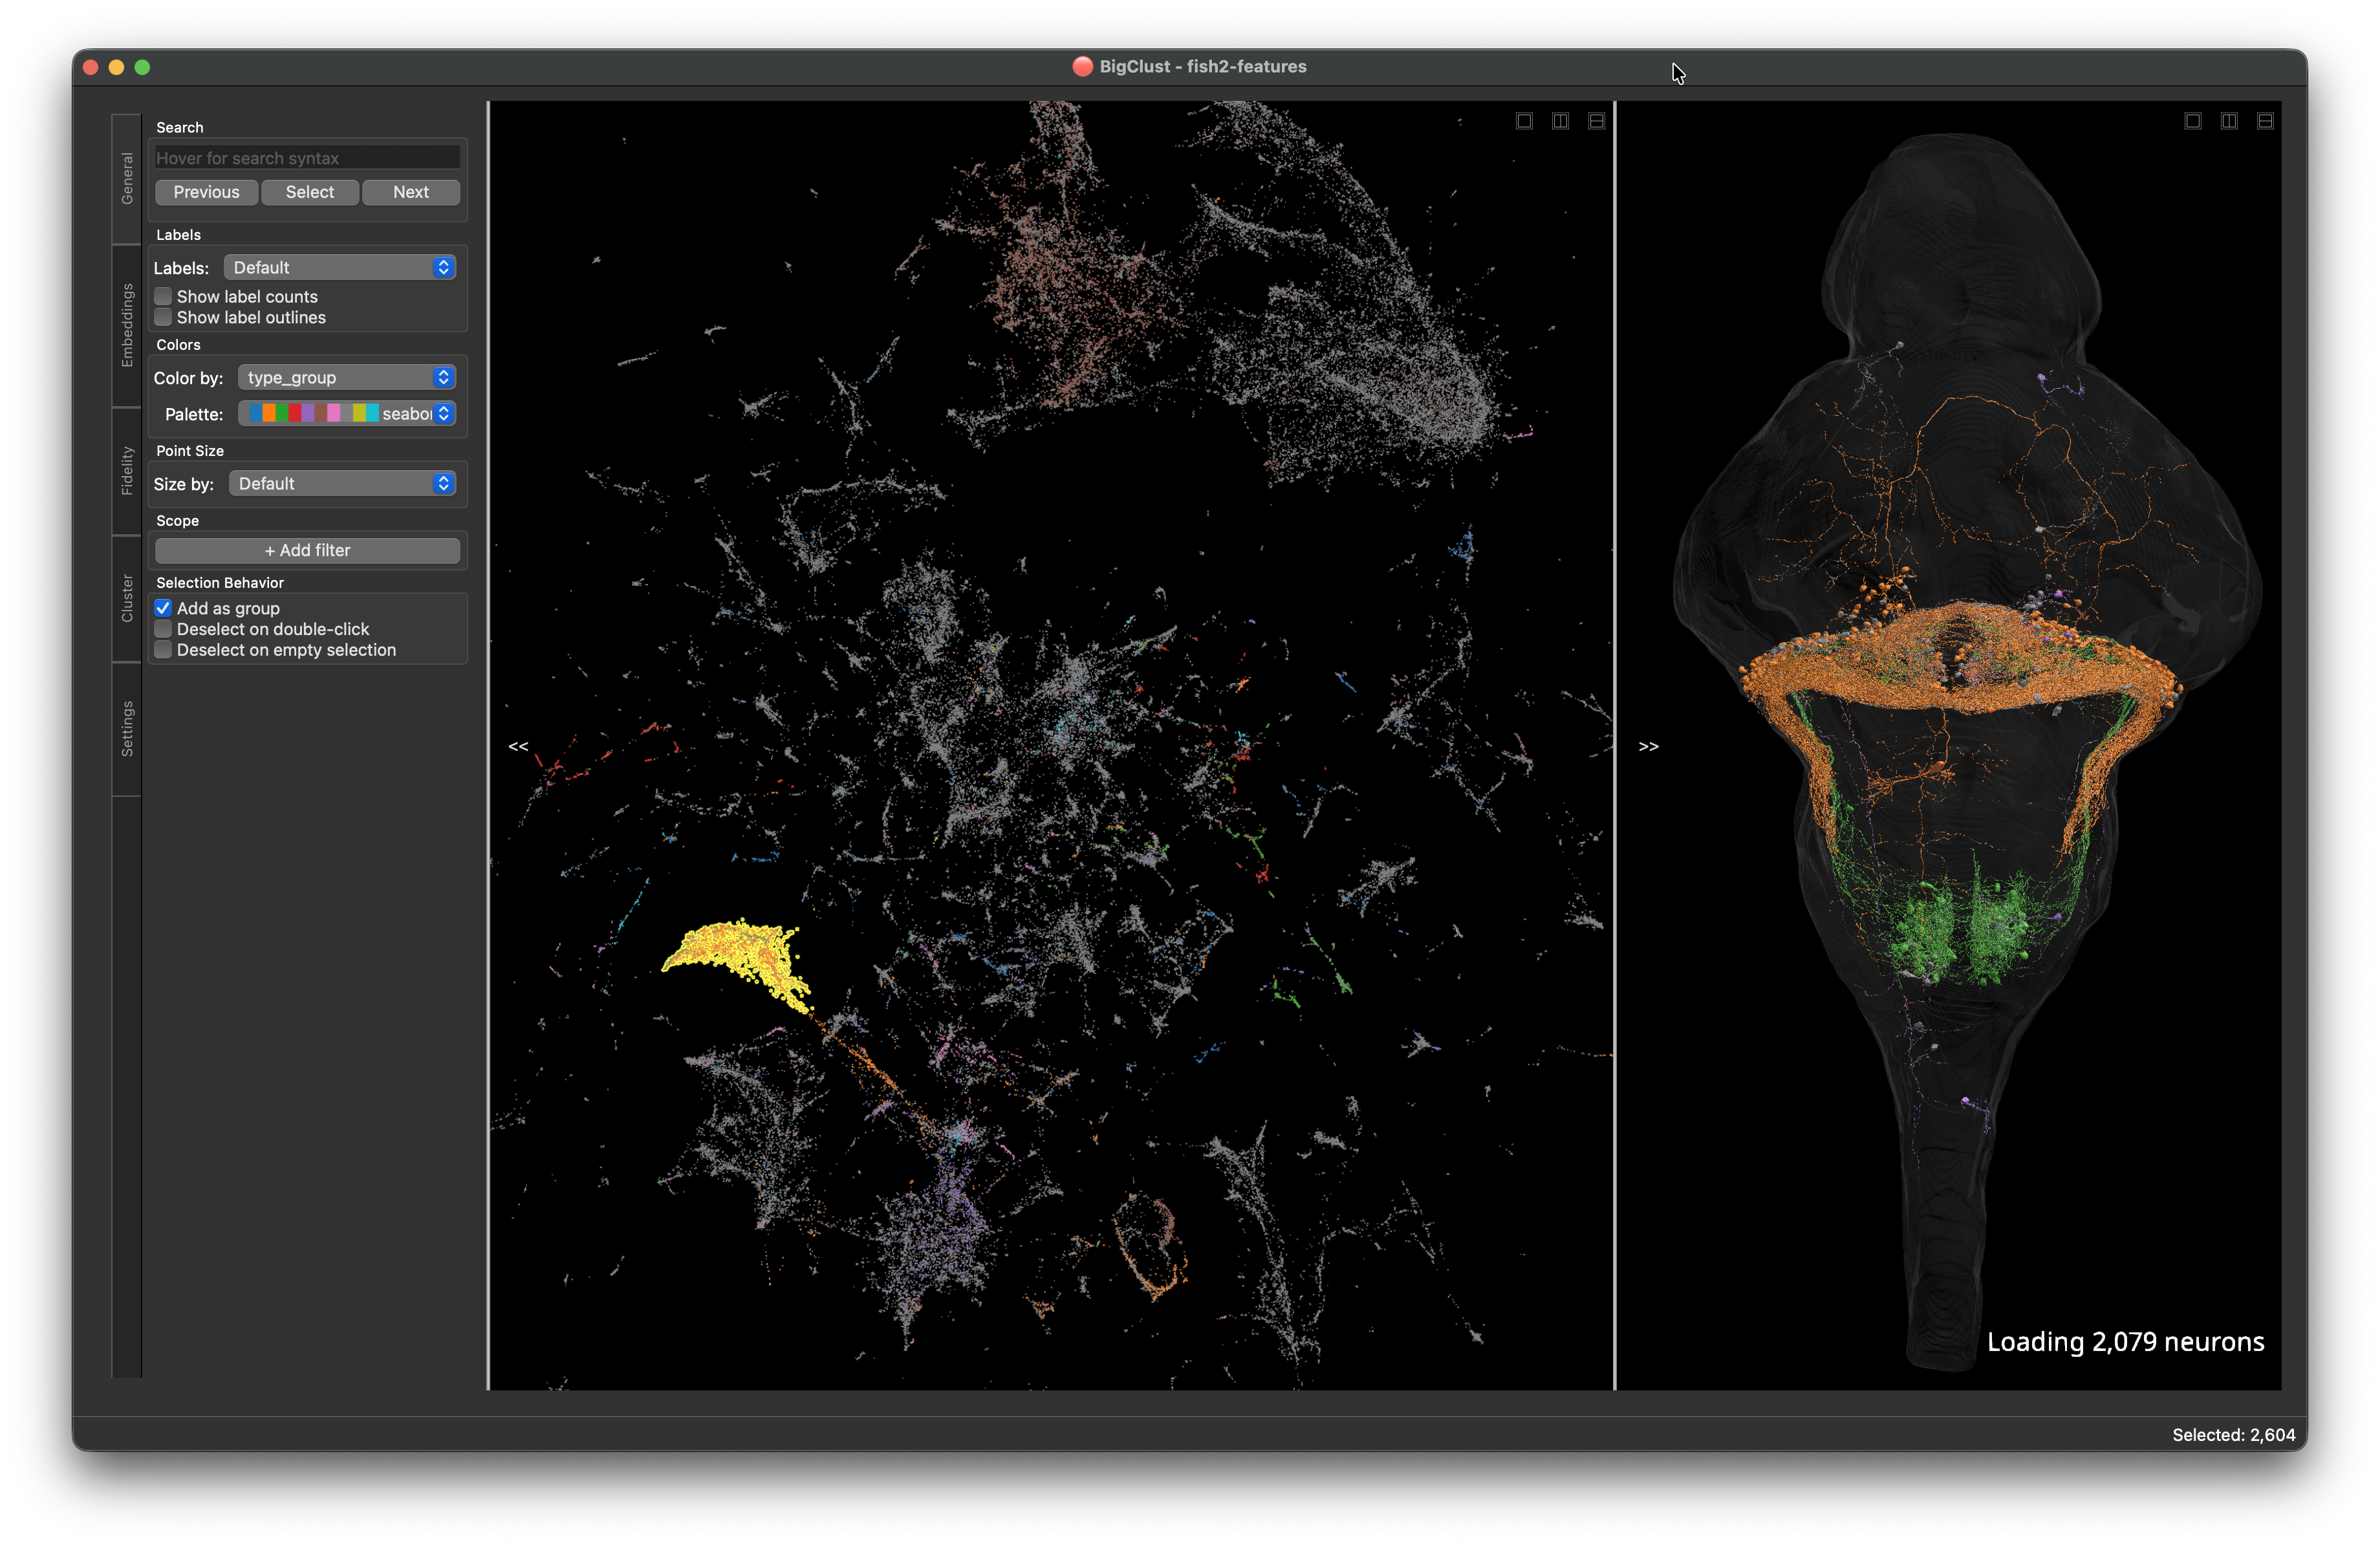
- Control panel tabs — General, Embeddings, Fidelity, Cluster, Settings. Toggle the whole panel with C. Reference →
- General tab — search, labels, colours, point size, scope filters. Reference →
- Scatter plot — the embedding. Box- and lasso-select, grow and shrink. How selection works →
- Pane layout — stack the two panes, put them side by side, or show one. Reference →
- 3D viewer — the neurons behind the selected points. Reference →
- Status bar — how many points are selected, plus the meta-staleness banner. Reference →
Three things it does that a notebook doesn't
Selection is the interface
Lasso a blob of points and the 3D viewer fills with those neurons. Grow the selection to pull in nearest neighbours, shrink it to step back, hide what you have already dealt with.
Selections carry across every widget at once — the connectivity table, the distance heatmap and the feature comparison all follow the same set of points.
Reclustering is a button, not a rerun
The embedding and the clustering are both recomputed in the app, from the same distances or features the project shipped with. Change the metric, switch UMAP for t-SNE, drop the feature groups you don't care about — the points animate to their new positions and every open widget follows.
Annotations go home
The type you decide on in the scatter plot can be written straight back to Clio, SeaTable/FlyTable or a CSV — with a mandatory validation step against the live backend before the first write is allowed.
A project is a directory
BigClust does not take a distance matrix as an argument. It takes a directory —
local or over HTTP — holding the data plus an info file that says what the data
is. This is the Neuroglancer model, and it means a clustering can be published at
a URL and opened by anyone with the link.
/my_clustering/
    info                <- JSON: what is here and how to read it
    meta.parquet        <- one row per neuron: id, label, dataset, …
    embeddings.parquet  <- the 2D coordinates the scatter plot draws
    distances.parquet   <- pairwise distances        (optional)
    features.parquet    <- the high-dimensional data (optional)
Only info and meta are strictly required. What you supply beyond them decides
what the app can do: without distances or features there is nothing to
recompute an embedding from, so the Embeddings and Cluster tabs have no input
to offer.
Building one is a short script — no database, no import step, no server.
Create a local dataset → · Why directories → · Full data format →
Get going
Install
No environment to create — uvx fetches and runs it. There is nothing to
configure until you want to write annotations.
Learn by doing
Nine short recipes, each one a numbered set of steps for a single task: load a remote dataset, recluster it, push what you found back to Clio.
Look things up
Every keyboard shortcut, every widget, every menu item and the complete info
file specification.
What it isn't
BigClust does not compute your clustering for you. It has no opinion about how you built your connectivity vectors or ran your NBLAST — that happens upstream, in something like cocoa, and lands in a project directory. What BigClust adds is the part that is genuinely hard to do in a notebook: looking at a hundred thousand points and the neurons behind them at the same time, and changing your mind quickly.
It is also not a proofreading tool. The 3D viewer renders meshes from a Neuroglancer source; it does not edit them.